

Configure a Data Widget
To be able to work with a data widget of any type, once you've selected which data sources you want to use, you'll need to add dimensions and metrics. These can be simple, aggregate, or custom. To be in a position to be thinking about dimensions and metrics, you need a template - see one of the articles below for guidance on creating a template.
Before getting started, it's important to note that you may sometimes be limited by dimension and metric combination limits. These limitations are unfortunately defined by the API of the data provider and are most often beyond NinjaCat's control.
Adding a Data Widget to Your Template
1. Access the Ninjacat Template Builder
2. Select either an already existing template or a new template from scratch
3. Click on the first tab of the four at the top of the inspector near the right to reveal the widget browser
4. Click on the "Data" heading in the widget browser to reveal the data widgets
5. Click on the icon that corresponds to the desired widget

Data Widget Settings Inspector Features
- When a widget is selected and you select Add Datasources / Dimensions / Metrics... the cursor will automatically be in the search bar (w/o an additional click) When a widget is selected and you are selecting options from the Datasources, Metrics, and/or Dimensions lists in the widget settings near the right, if nothing is selected, clicking on the "Enter" button will automatically select the first option at the top of the list._ Clicking on "ESC" will close the data sources, dimensions, and/or metrics section._* You have the ability to click on an "X" button within the search input area to clear any typed text._
Data
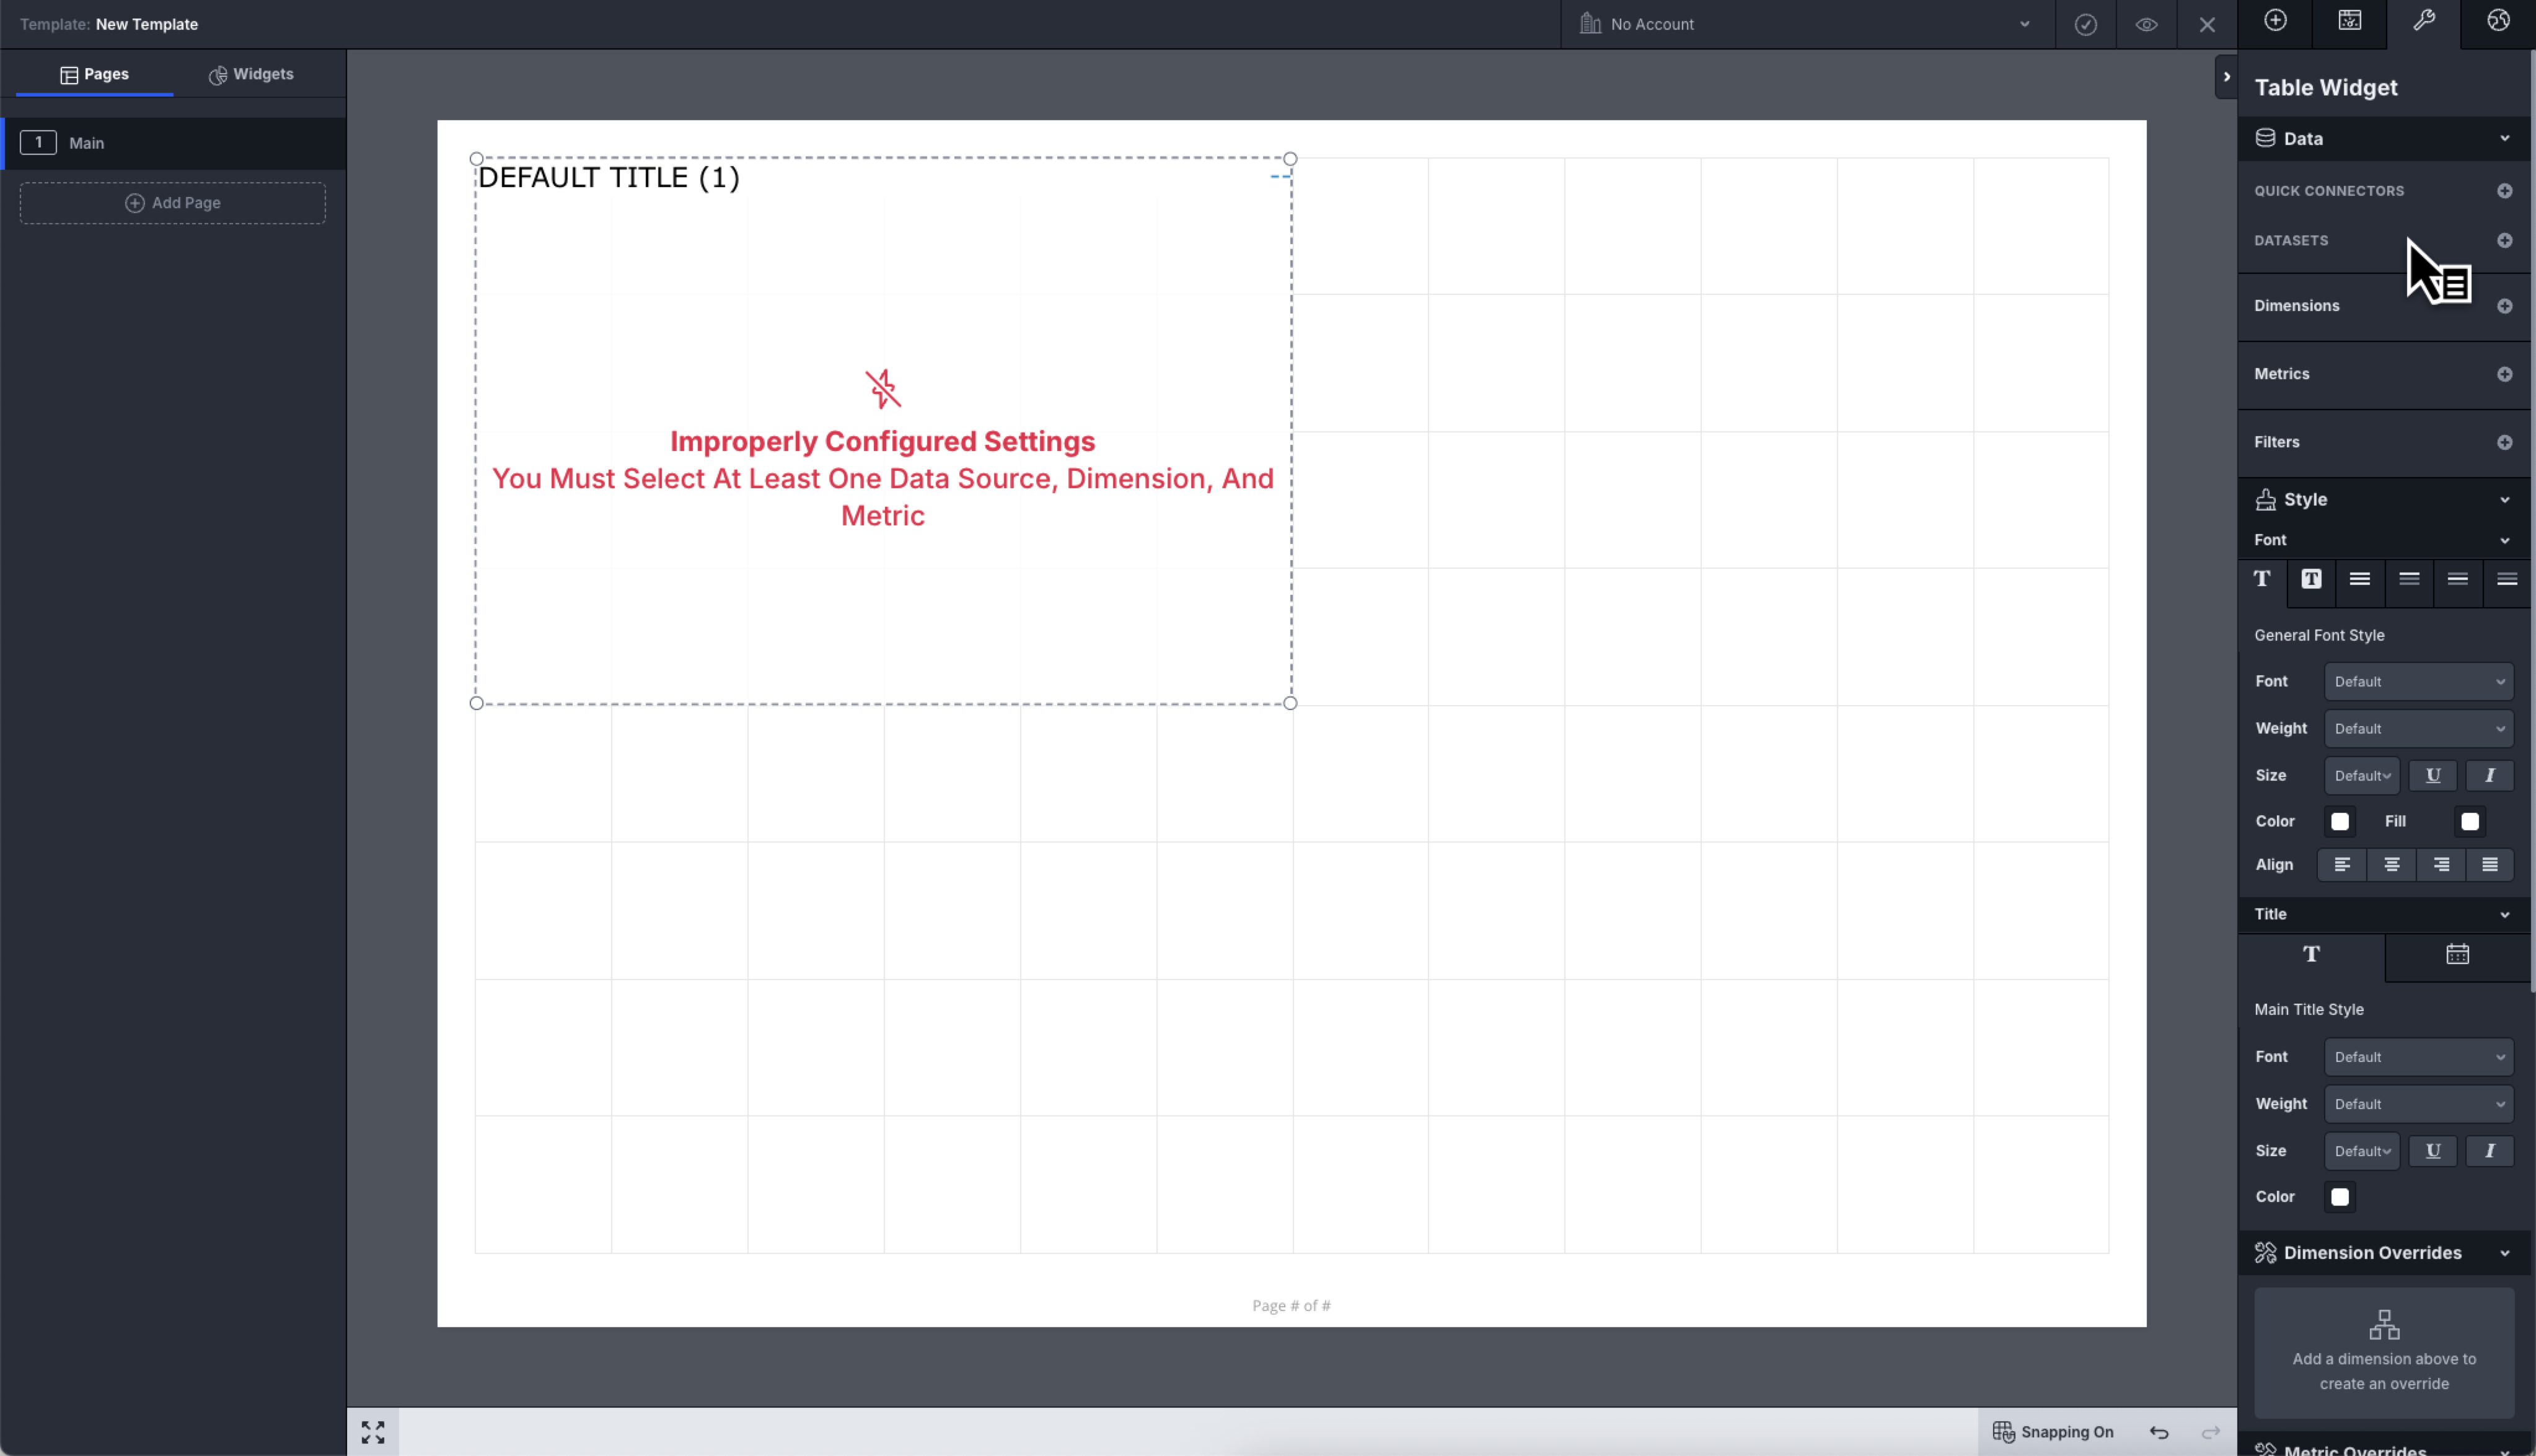
The main subject of this article, this section connects to data sources (datasets or quick connectors) and specifies the details of your initial widget data request
- Datasets - details below
- Quick Connectors - details below
- Dimensions - details below
- Metric - details below
Style

- Font - Widget data content text typefaces
- Title - Widget title bar text typefaces
Dimension Overrides

- Font - Multiple options for Dimension specific typeface changes
Metric Overrides

- Comparison Setting - Specific Metric options for the display of the Comparison values
- Font - Multiple options for Metric specific typeface changes
Properties

Widget specific customizable details that affect the widget as a whole
Select an account from the accounts drop-down in the top right so that you can pull data into your table as you're building it and make sure you're hitting your data story goals. Also, ensure the account you've selected to preview the data with has data sources set up for all of the data sources you're using in the widget.
Add Data Widget
Understanding Data Sources: Datasets vs Quick Connectors
NinjaCat offers two ways to connect your data to widgets:
Datasets (Recommended)
- Pre-stored data pulled from your connected sources (Google Ads, Facebook, SQL databases, etc.)
- Faster report generation and better reliability
- Enhanced preview capabilities showing available dimensions and metrics
- Option to use specific dataset views for targeted reporting
Quick Connectors
- Live data connections that pull fresh data at report generation time
- Immediate access to the most current data
- Organized in the Quick Connectors section below Datasets
Add a Data Source to Your Widget
Add a Dataset to Your Widget
- Click on your data widget to open up a list of configuration options in the 'Widget Inspector'. If the list of configuration options doesn't open, click the "wrench" icon in the top right.
Each widget has specific minimum requirements: these are explained in the red text in the widget itself when first created, displayed until you've met the widget criteria.
- Click on "Add Dataset" in the Datasets section of the widget's inspector.
- In the dataset selection modal:
- Select Dataset: Choose your desired dataset from the dropdown
- Select View (Optional): If your dataset has multiple views, select the specific view you need
- Display Name (Optional): Add a custom name to help identify this dataset in your template
- Preview Your Data: The preview section shows available dimensions and metrics from your selected dataset or view. This helps you understand what data fields you can work with.
- Explore Dataset (Optional): Click "Explore Dataset" to open the Dataset Explorer in a new tab for detailed data analysis.
- Refresh Preview: If changes have been made to your dataset, click "Refresh Preview" to update the available dimensions and metrics.
- Click "Add Dataset" to include it in your widget.
You won't be able to save your template at this stage - It is not possible to save a template while any widget is in an incomplete stage. Remember, it's good practice to only work on one widget at a time to avoid confusion when it comes to saving!
Add a Quick Connector to Your Widget
Click on your data widget to open up a list of configuration options in the 'Widget Inspector'. If the list of configuration options doesn't open, click the "wrench" icon in the top right.
- Scroll down to the "Quick Connectors" section and click on "Add Quick Connectors".
- Search for the data source(s) you want to add using the search box and select the data source(s) by clicking on each one in turn. Once selected, the data source(s) will show ticks next to them.
- Click on the back arrow next to the Quick Connectors header to return to the main widget inspector page.
You won't be able to save your template at this stage - It is not possible to save a template while any widget is in an incomplete stage. Remember, it's good practice to only work on one widget at a time to avoid confusion when it comes to saving!
Adding Data Source-Specific Dimensions
1. To add a simple Dimension, click on the small plus (+) next to the Dimensions subheading inside the widget inspector. This will open up a list of all dimensions.
2. Search for the dimension(s) you want to add using the search box, and select clicking on it. Once selected, the dimensions will show a tick next to it.
The Dimensions are listed under headings taking the name of the data source you've added showing the data source specific dimensions, and also as under the heading of Aggregate - in this instance, these are common dimensions that are available across multiple data sources, such as Account, Date, Day of Week, Campaign Name, etc.

If you've added more than one data source, you'll need to either use the aggregate dimensions presented in the dimensions list, which is done as in the section or, if the dimension you're looking for isn't there, create a 'Custom Dimension'.
3. Once you've selected your dimension(s), click on the back arrow next to the Datasource header to return to the main widget inspector page.
4. Next you need to add a Metric.
You still won't be able to save your template at this stage - It is not possible to save while any widget is in an incomplete stage. Remember, it's best practice to only work on one widget at a time!
Using Aggregate Dimensions
1. If you've added more than one data source to your widget, navigate to the widget inspector, scroll down to the Dimensions section. Click on 'Add Dimension' to expand the available Dimensions list.
2. Use the search box to type the name of the Dimensions you're looking for if you know it, or scroll through the list to find your Dimension.
You will notice in this instance there are ONLY aggregate dimensions listed. If you want any specific data source dimensions, you will need to use the custom dimension builder. We'll explore that next.

3. Click on the name of any aggregate dimension(s) you want from the list to add them to your widget. You'll see your dimension show at the top of the dimensions list with a tick next when you've successfully selected it.
4. Once you've selected your dimension(s), click on the back arrow next to the Datasource header to return to the main widget inspector page.
You still won't be able to save your template at this stage - It is not possible to save while any widget is in an incomplete stage. Remember, it's best practice to only work on one widget at a time!
Using Custom Dimensions
Custom Dimensions allow you to build a dimension - for example if one data source calls its dimension 'landing page title', and the other data source calls the same dimension 'landing page name', you can use the custom dimension builder to instruct NinjaCat to view these as the same Dimension, which you can then custom name.
1. Click on the three vertical dots next to the small plus (+) next to the Dimensions header in the widget inspector, then select 'Custom' from the resulting menu
2. Appropriately fill in the fields in the Custom Dimension Editor

- Name - Title of your dimension
- Hide - Toggle on (Toggled Right) to not display the dimension visually in the widget
- Non-Segmenting - Toggle on (Toggled Right) to not segment the data by this dimension
- Display As - Select the format for how you want the dimension to appear
3. Under the Dimensions to Aggregate section, for each data source, select the appropriate dimension you want to include from the list of available dimensions.
4. Click on OK to create your Custom Dimension.
You still won't be able to save your template at this stage - It is not possible to save while any widget is in an incomplete stage. Remember, it's best practice to only work on one widget at a time!
Adding Metrics To Widgets
At least 1 Metric is required for all data widgets - it's the measurement of performance. In many of the data widgets, you can add one or more metrics to provide greater detail on overall performance, such as displaying Impressions alongside Clicks, Cost, and CPC.
1. To add a simple Metric to your data widget, click on the small plus (+) next to the Metrics subheading inside the widget inspector. This will open up a list of all available metrics.
2. Search for the metric(s) you want to add using the search box, and select clicking on it. Once selected, the metrics will show a tick next to them.
The Metrics are listed under headings 'Aggregate' meaning these are metrics that are common across multiple data sources, and also by the data source you've added showing the data source specific metrics that we have not identified as easy to aggregate.

3. Once you've selected your metric(s), click on the back arrow next to the Metrics header to return to the main widget inspector page.
4. You are now able to save your template as your widget is deemed to be complete.
Adding a Custom Metric
Custom Metrics allows you to combine metrics from individual data sources to build very specific calculations. - for example, if you're measuring clicks from one data source, but cost from another, the aggregate CPC metric won't give you what you want. Creating metrics in the custom metric editor allows you to specify exactly the calculation you want to use.
1. Click on the three vertical dots next to the small plus (+) next to the Metrics header in the widget inspector, then select 'Custom' from the resulting menu
2. Appropriately fill in the fields in the Custom Metric Editor

- Name - Give your Custom Metric a Name.
- Hide - Toggle on the 'Hide' switch if you DO NOT want to display your metric.
- Display As - dropdown, select the most appropriate display option for your custom metric:
- Decimal Formatting - option is the most relevant to your metric - you'll see the option you've chosen from the drop-down demonstrated to the right of the Decimal formatting box. As default, this will use the Template settings, defined in the global settings.
- Formula - Use the Insert Metric Box, Insert Operator, Insert Constant, and Insert buttons to build your metric.
- Insert Metric -
- Search for the first metric you want to include from the Insert Metric dropdown - as usual, the search box reduces the need for scrolling through the list of all available metrics if you know the name of the metric.
- Once you've found the metric you want to include, either aggregate or data source-specific, click on it from the list to highlight it. Then click Insert to insert it into the formula bar.
- Next, click insert operator to insert the relevant operator (Add, Subtract, Multiply, Divide, or brackets) to build your formula. In this example, we're going to look to build CPC as "Analytics cost / Facebook Clicks" displayed as a currency.
- Continue to build your formula, inserting metrics and operators until your formula is complete. If you want to include the number of accounts or rows in your formula, you can insert this from the 'Insert Constant' dropdown.
- Once your formula is complete, check that it is valid - there is a red error message at the bottom of the custom metrics editor window next to the OK and Cancel buttons which will tell you if your formula is Invalid, or valid.
- Click OK to include your metric in your widget, or cancel to go back to the widget inspector without adding the custom metric.
3. You can now save your template.
Changing How a Metric Aggregates
By default, NinjaCat aggregates metrics in your widget using the aggregation method defined on the underlying dataset (most commonly Sum). If you need a metric to display as an Avg — or any aggregation other than the default — there is no aggregation toggle in the widget inspector itself. The widget inspector lets you choose which metrics to display, but not how those metrics are aggregated.
To change a metric's aggregation method (e.g., from Sum to Avg), use a Dataset View.
Use a Dataset View to Change Metric Aggregation
- Navigate to Datasets in the main navigation and open the dataset that powers your widget.
- Scroll to the Views section and either create a New View or edit an existing one.
- In the view, locate the metric you want to re-aggregate and change its aggregation method to your desired option (for example, Avg instead of Sum).
- Save the view.
- Back in your template, open the data widget's inspector → click Add Data Source → use the View dropdown (Optional) to select the view you just configured.
- Save your template. The metric will now display using the aggregation method defined on that dataset view.
Tip: Just need a total in a table?If you only need a single total value (rather than a row-by-row breakdown), consider using a Scorecard widget instead of a Table widget. Scorecards naturally display a single aggregated value and often remove the need to reconfigure aggregation at all.
Troubleshooting: Widget Data Not Populating
If a data widget is showing no data, blank values, or appears empty, the cause is usually a configuration or data-availability issue rather than a problem with the widget itself. Work through the following checks — more than one of these can apply at the same time, so review all of them before concluding the widget is broken.
1. The wrong account is selected
Confirm the widget is pointed at the account you expect. If the widget (or the report/dashboard it lives in) is scoped to a different account than the one holding the data, the widget will correctly return nothing.
- Open the widget's Data settings and check the selected account.
- If you're viewing a report at the dashboard or page level, verify the account context applied there as well.
2. The date range has no data
A widget only shows data that falls within its active date range. If the selected range falls outside the period where data exists — or is set to a window that hasn't received data yet — the widget will appear empty.
- Check the widget's date range (and any date range override applied to it).
- Widen the range to confirm whether data appears for a different period.
3. The dataset is still syncing
If the underlying dataset hasn't finished loading, the data simply isn't available to display yet. This is common immediately after connecting a new source or kicking off a rebuild.
- Open the dataset and confirm its sync/load status is complete before expecting data in the widget.
- If a sync is in progress, allow it to finish, then refresh the widget.
4. The widget is bound to the wrong data source
A widget can be configured against a data source that doesn't contain the dimensions or metrics you're trying to display, which results in empty output.
- Review the widget's Data settings and confirm the data source (Dataset or Quick Connector) is the one you intend to report on.
- Verify the dimensions and metrics added to the widget actually exist in that source.
5. No data source is mapped to the widget
A widget with no data source attached has nothing to render.
- Open the widget's Data settings and confirm at least one data source (Dataset or Quick Connector) is added.
- If none is present, add the appropriate data source and re-add the needed dimensions and metrics.
If you've worked through all of the above and the widget is still not populating, capture the widget configuration and the account/date range in use, and reach out to NinjaCat Support.
Updated 3 months ago